Do you want to use Google Analytics 4 (GA4) but are unsure how to start?
Google Analytics 4 is the latest version of Google’s analytics platform. It has many changes, like a new reporting system and metrics. The way GA4 collects and processes data is also different from the previous version known as Universal Analytics (UA).
In this article, we’ll cover everything about GA4 in WordPress and help you get started.
What is Google Analytics 4?
Google Analytics 4, also called GA4, is the new version of Google’s stats dashboard, and it lets you track your website and apps in the same account. It is designed to protect users’ privacy and provide more accurate reports than previous versions.
With Google Analytics 4, you’ll first notice that it has a new interface. It also categorizes some of the old reports differently, as well as adds all-new reports and metrics.

Behind the scenes, GA4 works in a new way for collecting and processing your website data. It records data as event-based instead of using page hits.
For example, when your visitors click a link, view a page, play a video, or download a file, all these website interactions will count as events.
This way, your website performance is measured more accurately, as the event-based model can better track user behavior.
It also makes it easier to enable enhanced measurement features like tracking outbound clicks and scroll depth. You can enable these options with a click of a button instead of performing a complicated setup process.
That said, let’s see why you should use Google Analytics 4 instead of the previous Universal Analytics.
Why Switch from Universal Analytics to Google Analytics 4?
If you haven’t created a GA4 property yet, then you should know that Google will sunset the old Universal Analytics on July 1, 2023.
This means that Universal Analytics will no longer record data from your WordPress site after the sunset date. You’ll still be able to view your old data for at least 6 months after the sunset date, but Universal Analytics won’t track your site’s traffic.
That’s why it is important to switch to a Google Analytics 4 as soon as possible. You won’t have to start from scratch when Universal Analytics stops working and have historical data in GA4 for comparison. Plus, you’ll get all the new features and improvements with Google Analytics 4.
The best way of setting up GA4 is using MonsterInsights and its dual tracking feature. Dual tracking allows you to use Universal Analytics while simultaneously sending data to the GA4 property.
There’s also a free version of MonsterInsights that you can use if you’re just getting started.
For more details, please see our guide on how to switch to Google Analytics 4 in WordPress.

On the other hand, if you’ve just started a new website and want to set up analytics tracking code, then follow our guide on how to install Google Analytics in WordPress.
Now, let’s look at some of the changes you’ll notice in GA4.
What Has Changed in Google Analytics 4?
The new Google Analytics 4 brings a lot of changes to the analytics platform. While the most noticeable difference is how it works using events, here are a few more changes you’ll see in GA4:
1. A Completely New Reporting Interface
As we mentioned earlier, the first difference you’ll see is the new Google Analytics 4 interface. Many reports from Universal Analytics have been removed or renamed in GA4.

For example, you will see reports like Engagement, Monetization, and Retention in Google Analytics 4.
2. New Metrics in Google Analytics 4
In Google Analytics 4, you’ll find new metrics. Some metrics names in Universal Analytics have also changed in GA4.
For instance, the new engagement report helps measure your visitors’ interaction with your site, and it offers metrics for average engagement time. In Universal Analytics, this was called average session duration.

Another noticeable change is that there is no bounce rate metric in GA4.
Instead of seeing a percentage of how many people left your site without interacting, you’ll see metrics like Engaged sessions per user to see how people used your site and interacted with your content.
3. There are No Goals in GA4
If you had set up different goals in Universal Analytics, then you won’t find them in GA4. However, you get various GA4 events to help you track user interactions on your website.

For example the number of users who began the checkout process in your online store is an interaction event. You can also see events for anyone who reached different points in the checkout process.
That way, you can see which specific steps in the process people give up at.
4. Absence of Form Conversion Tracking
Tracking your WordPress forms is important in understanding how people use your website. Forms help gather leads, get user feedback, resolve queries, and more.
However, you won’t know which form performs best without tracking them in Google Analytics. With MonsterInsights, you can easily track forms out of the box and see a report inside your WordPress dashboard.

For even more control over the forms on your site, we recommend installing WPForms, the best form builder plugin for WordPress. It integrates with MonsterInsights, too, so you can get even more useful information out of Google Analytics.
5. Perform Advanced Analysis to Uncover Insights
One of the most powerful changes GA4 brings is the ability to perform advanced analysis and create multiple data visualizations.
You can head to the Explore tab and create custom reports. There are prebuilt templates you can use or use a blank template.

For example, you can perform a funnel analysis and see the steps customers take before purchasing. Similarly, the path exploration template helps you see which events users trigger as they visit your website.
However, this feature is for advanced or power users who are experienced with Google Analytics 4 and know their way around. It can be tricky for beginners since there is a steep learning curve.
As an alternate, you can use MonsterInsights to add a stats dashboard inside your WordPress site and see data that matters for your business.
How to Use Google Analytics 4 Reports
Now that you know what Google Analytics 4 is, how it works, and what’s the difference between GA4 and Universal Analytics, let’s see how to use different reports.
Realtime Report
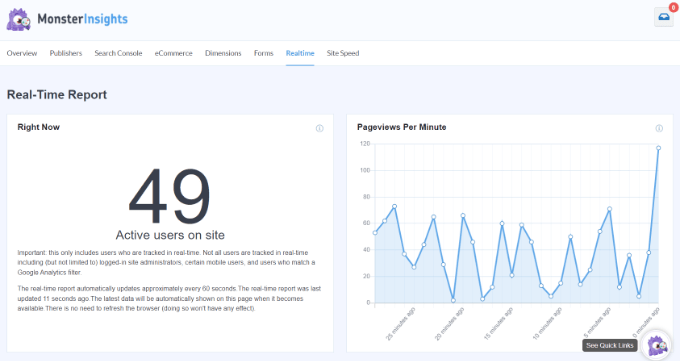
The first report you can view is the real-time report in Google Analytics 4. It helps you monitor your website activity as it happens.
You can use the report to see if your analytics tracking code is working, track the performance of a campaign like a flash sale in real-time, see traffic from social media campaigns as it happens, and more.

If you’re using MonsterInsights, then you can quickly see the real-time reports inside your WordPress dashboard. You just need to go to Insights » Reports in your admin panel, and then just click on the ‘Realtime’ tab.
The plugin brings important data from Google Analytics and displays them in easy-to-understand reports. This way, you can quickly see data that matters for your business and check how your site performs.

For more details, please see our guide on how to show real-time online users in WordPress.
Acquisition Report
The acquisition report is part of GA4’s ‘Life cycle’ reports, and you’ll see where your visitors are coming from. It shows the channels that are driving traffic to your website.
For example, you can see whether people use search engines like Google and Bing, directly typing in your website URL in the browser, clicking on paid search ads, and more.

Using this report, you can figure out which channels to invest your resources in and get the maximum result. It also helps optimize your WordPress SEO and increase organic traffic to your website.
Engagement Report
The engagement report is a new report you’ll see in Google Analytics 4. It helps you track how many people are engaged with your website.
Under this report, you’ll find more sub-reports to track different events and conversions, as well as see your most important pages and app screens.

These reports are important in understanding how people use your website. For example, you can see which page is getting the most views. Using the data, you can create similar content to get more website traffic.
Monetization Report
If you run an eCommerce store, then you can view its performance in the Monetization report.
For instance, this report shows the total revenue, purchases, average purchase revenue per user, and other metrics.

You can also see the eCommerce purchases report to find out which products get the most sales in your store.
With MonsterInsights, you can easily see your top products inside your WordPress admin panel. Its eCommerce report shows an overview of your store’s performance along with the best-selling products.

Using this information, you can display your popular products throughout the website, upsell other products, and offer bundles and discounts to boost sales.
For more details, please see our guide on how to set up eCommerce tracking in WordPress.
Retention Report
A retention report helps track how many new users visit your site compared to returning users.
You can use this data to bring back users to your site by getting them to sign up for your newsletter or follow you on social media. On the other hand, you can offer exclusive discounts or free resources like ebooks for returning visitors to get more conversions.

In the retention report, you can also see graphs for user engagement and user retention over time, lifetime value, and more.
Demographics Report
Under the User section of GA4, you will find your demographics data, where you can see which country your visitors are coming from.
This helps create geolocation marketing campaigns and personalized messages for users from different locations. For example, you can offer exclusive discounts for people coming from Singapore or come up with blog topics for users from India.

It even breaks down the language your users speak, so you can translate your website into the most popular languages.
With MonsterInsights, you can also view this data inside your WordPress dashboard. Plus, it also shows a device breakdown, top referrals, top countries, and new vs. returning visitors reports.

Tech Report
The last report you’ll see in Google Analytics 4 is the Tech report. It shows the device your visitors use to view your website, such as whether they are on desktop, mobile, or tablet.
Besides that, you can also see the operating system, browser, screen resolution, and app version people are using when visiting your site.

This report is especially useful when optimizing your site for multiple devices. You can provide a better user experience and ensure that people can easily read your content on any device.
We hope this article helped you learn about Google Analytics 4 in WordPress. You can also see our guide on how to increase your website traffic, and the must have WordPress plugins to grow your website.
If you liked this article, then please subscribe to our YouTube Channel for WordPress video tutorials. You can also find us on Twitter and Facebook.
The post The Ultimate Guide to GA4 in WordPress for Beginners first appeared on WPBeginner.


